
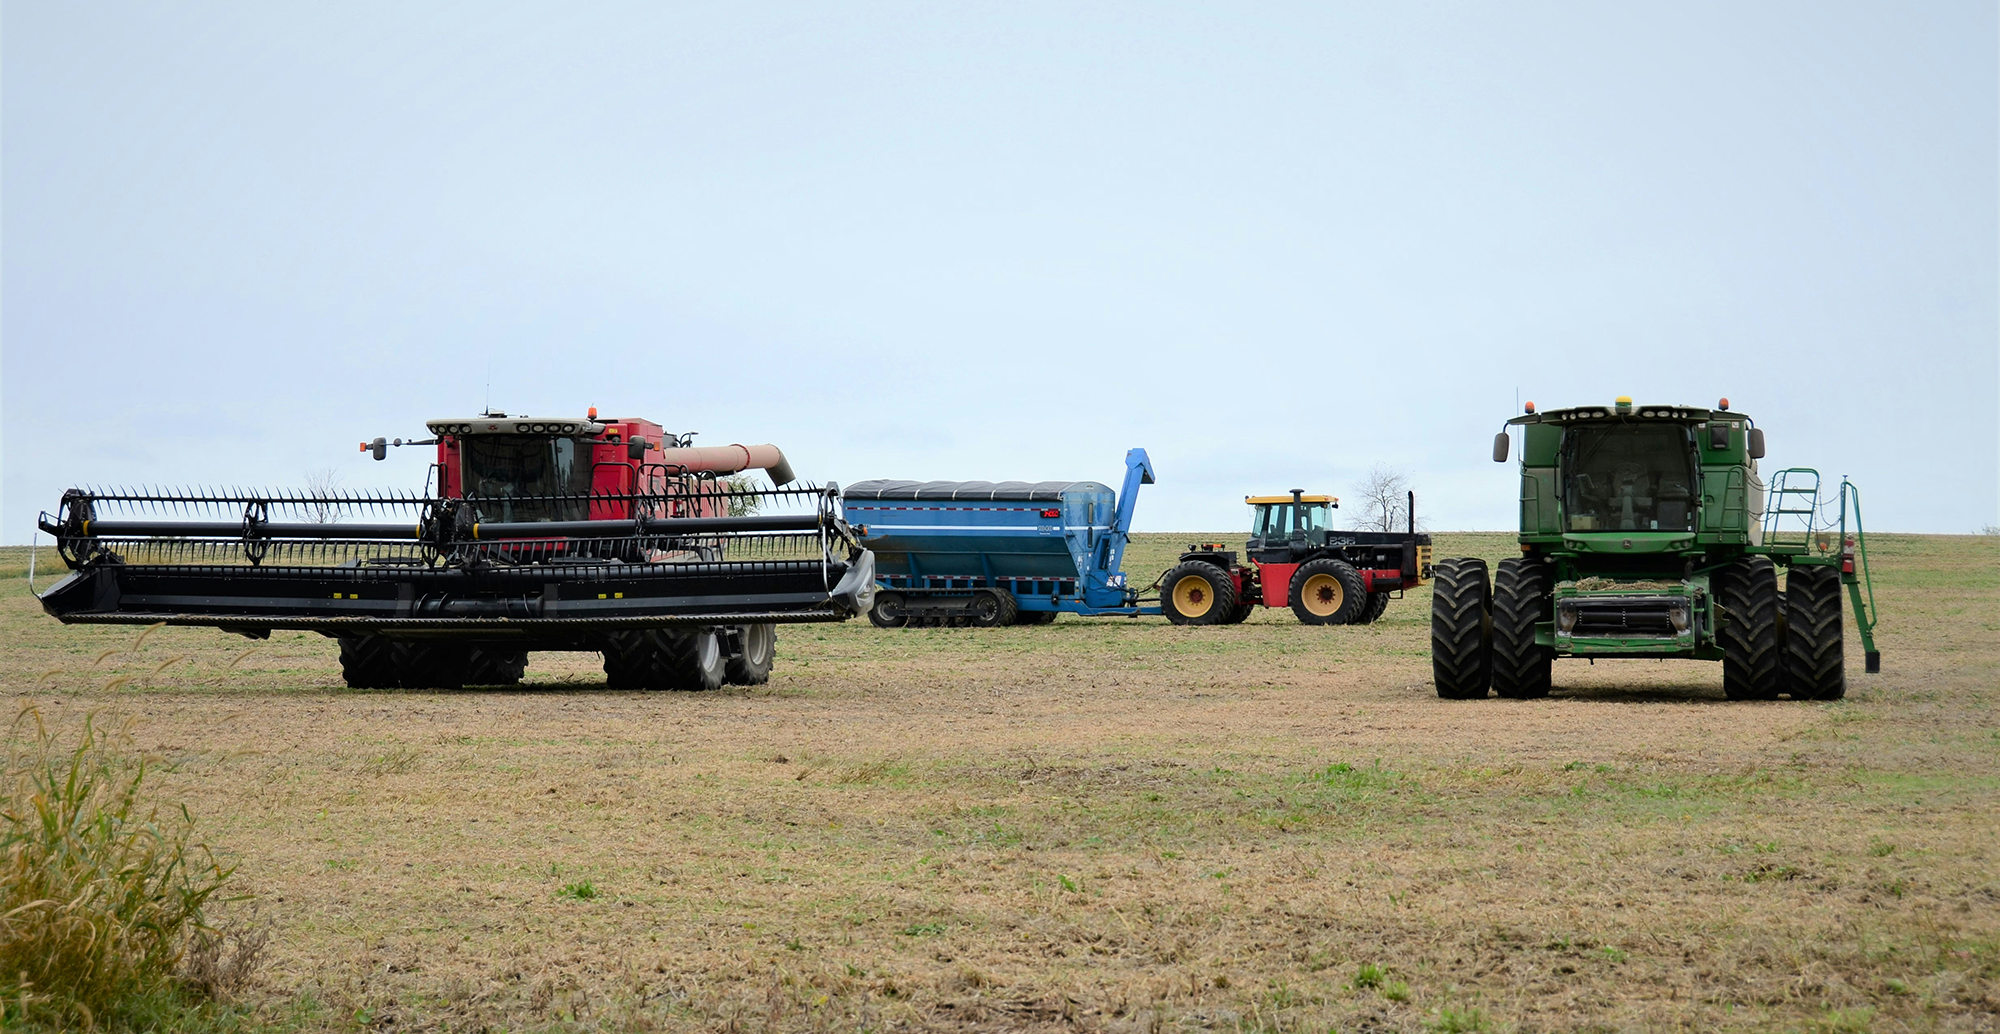
How are yield maps created from multiple combines in the same field?
If you have multiple combines running on your farm at harvest, you can get unified yield maps for the whole operation by adding FarmTRX yield monitors. Regardless of the make, ages and models of the combines in field, data collection can be simplified and standardized with the farmer getting seamless yield data and maps all from one add-on system.
The FarmTRX harvest monitoring kit is a universal, retrofit yield monitor and periphery sensors that can be installed on any combine with a clean grain elevator and 12V switched power, equipping the harvester for precision yield monitoring and automated yield map creation in every field. When FarmTRX yield data is synced to the farmer’s online Web App account, yield maps will begin to generate immediately for all harvested area covered by the yield monitors. Differences between multiple combines in the same field (like calibration factors, operator involvement, header values etc.) are interpreted and resolved in the Web App processor and generated into yield maps. The process of yield data clean up and processing into maps is automatic and fields are completed within minutes of data sync. What does the farmer end up with? Unified, cohesive yield maps for the whole farm that are ready to support agronomic review and decision making.
Here is how yield data from multiple combines is treated in the Web App:
When multiple harvesters are similarly calibrated during harvest using weigh wagons, a grain cart with scales or even a simple volume measurement (like the known volume of a combine grain tank or hopper-full), not much adjustment is required in the Web App to normalize the collected yield data between different combines. Regardless, a multi-combine correction check is undertaken in the Web App automatically.
Multi-combines with different calibrations
Consider some of the factors that may lead to differing calibrations for multi-combines in the same field: an operator missed performing an in-field calibration for the crop type altogether, one combine may be running at a different threshing speed than the others, several different calibrations were performed for the same combine all within the same field, or simply – there are different combine makes and models running in one field. In the Web App, you’ll notice a map layer called “Raw Points” and “Raw Map”. These layers reveal what that map would look like without Web App correction and processing. Segments of the map are distinctly (visually) separated between harvesters, ultimately rendering a harvest report card that’s unhelpful for comparing true yield performance across an entire field or entire farm. Check out this example:


Transformation from raw points to Corrected Maps (automatic)
Multi-combine checks and corrections are part of the processing of yield data when it is synced to the Web App, so the farmer gets a suite of corrected maps for each field that reveals true yield trends that surpass day-to-day harvest conditions (combine unloading in the field, breakdowns, plugged threshers, multiple combines with different or missing calibrations).
Without saying too much, here’s part of the clean-up process and why it works:
To address different combines harvesting in the same field, sophisticated algorithms compare combines working in close proximity to each other and determine how each can be statistically re-calibrated to produce an accurate picture of yield over a wider area. This addresses visual striping that is evident in the raw (un-corrected) yield map – called the Raw Map. This process helps produce accurate yield trends and sums when no calibration can be found for the other combine. If the farmer later adds the known field total post-harvest, the individual data from each combine is reprocessed to sum to the new known totals. Post-harvest calibration tools in the Web App allow the farmer (or the farmer’s agronomy team) to get accurate, unified yield maps after harvest, from uncalibrated Yield Monitors.
How many combines can the Web App handle?
Fortunately, there’s no limit. As long as FarmTRX Yield Monitors are added to the machines, seamless yield maps will be created for all combines running in the same field. How many is too many? Check out this example from a FarmTRX customer farming in Ukraine, where 9 combines in 520 ac./210 ha. fields are the norm. So far, no problem for the FarmTRX Web App. Note the way the yield trends reflect the soil properties of old stream beds, regardless of which combine is providing the data.
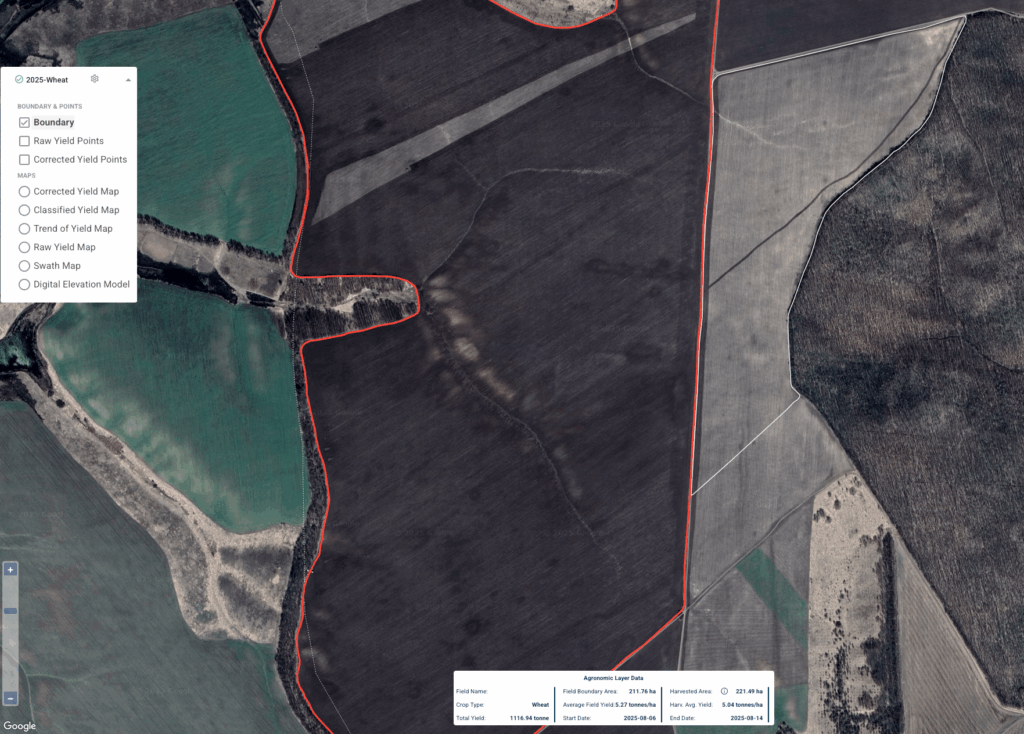
Field Topography from Google Maps
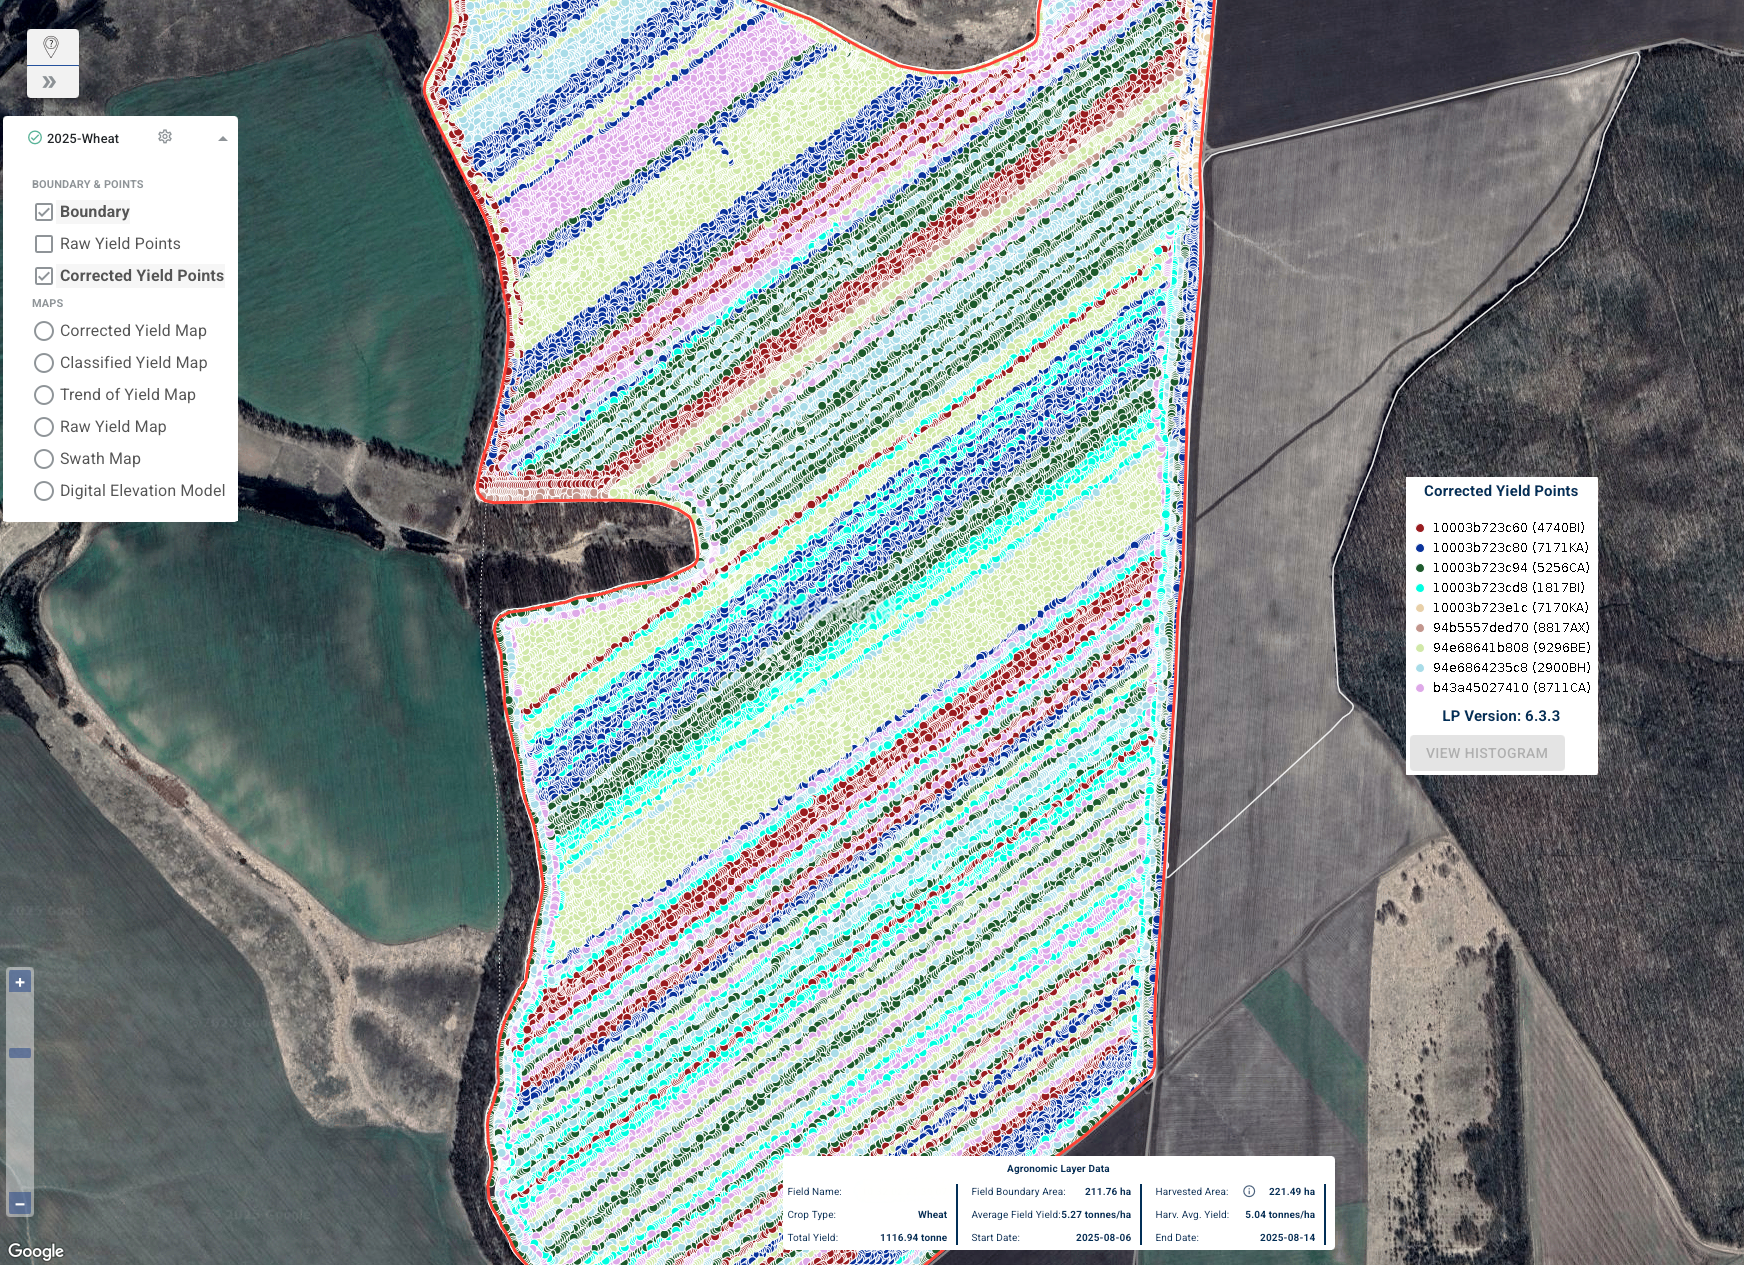
Corrected Points Layer – each colour is a different combine in the field
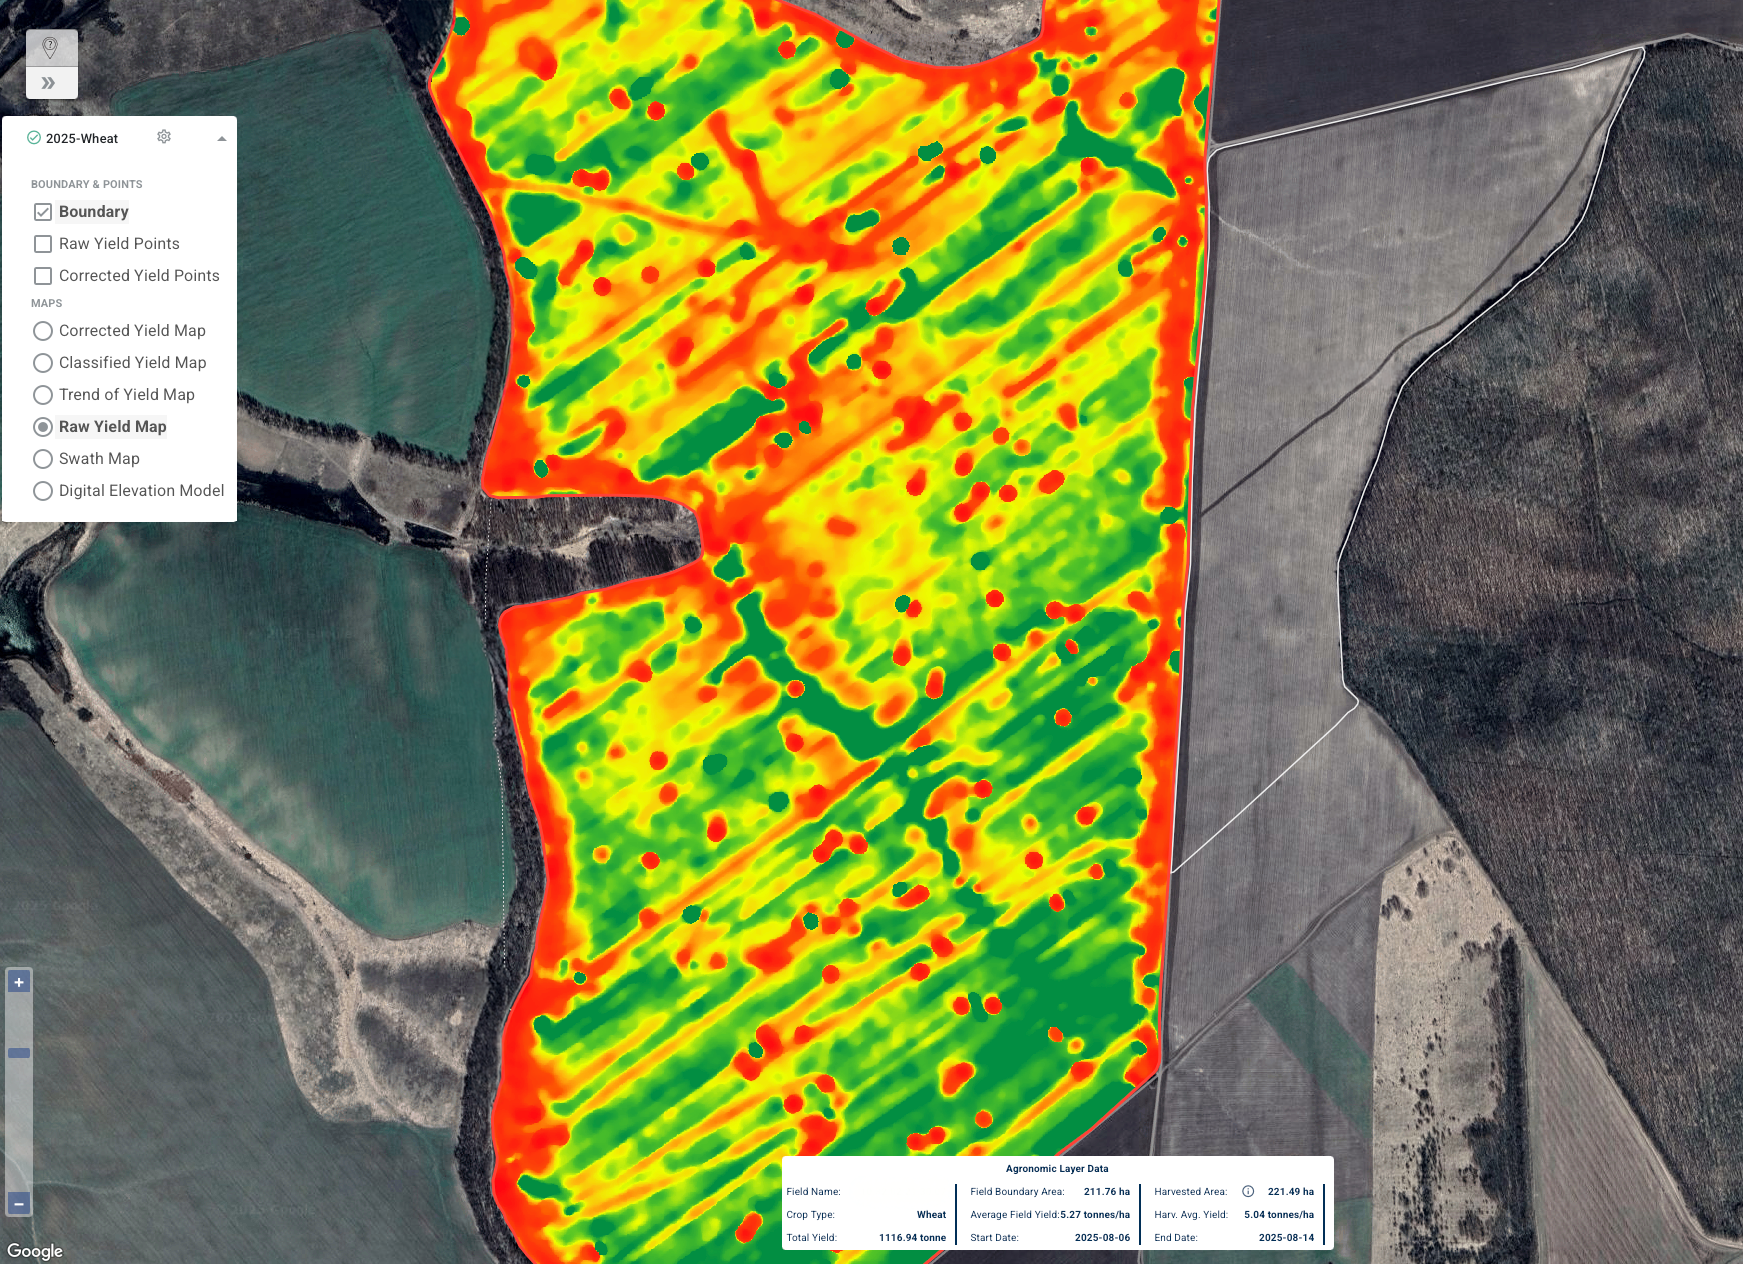
Raw Map – no corrections applied to raw recordings
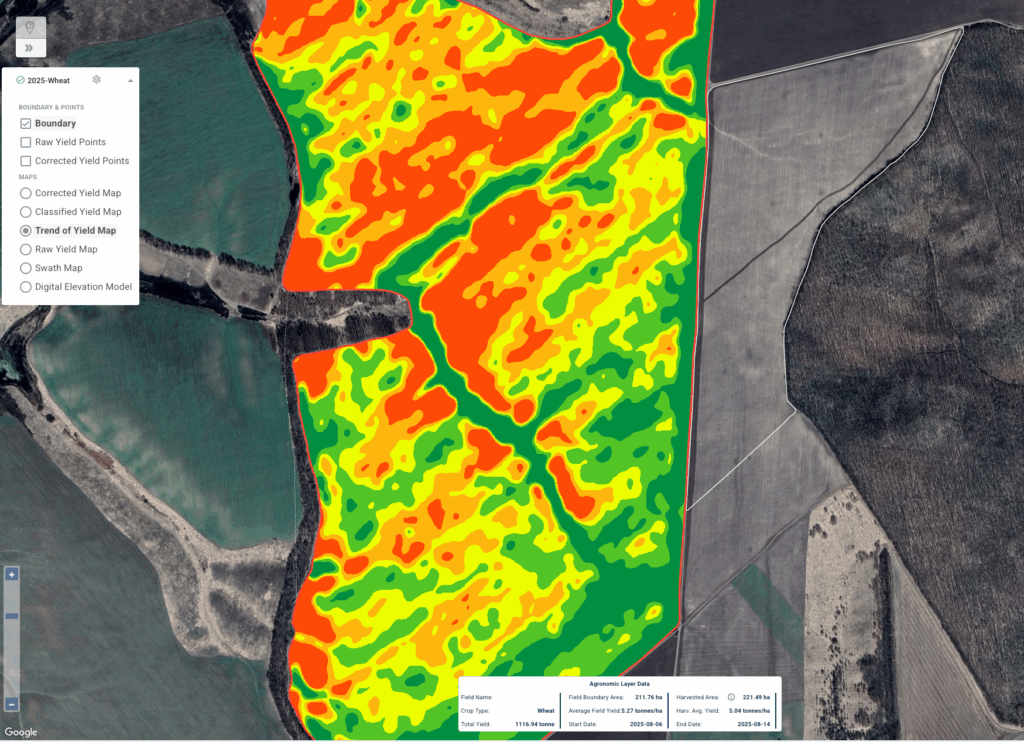
Trend of Yield Map – one corrected map from 9 combines
