The FarmTRX Web App

Cloud-based precision agriculture

The FarmTRX Web Application is a cloud-based platform where farmers can view and share their collected yield data. It’s available in two versions; Basic and Premium. The free Basic version lets you view raw data, or export it as .shp files to a third party platform for further processing. The Premium Web App is a paid subscription service that delivers cleaned, accurate yield data and maps that show true yield performance with high-level fidelity.

Premium Web App auto-corrects data for 

  • Headland turns
  • Hills
  • Multiple combines with different calibrations
  • Unloading points
  • Sharp starts and stops due to plugging
Key Features

Auto-Yield Correction

FarmTRX leverages years of GIS mapping and tracking expertise to deliver an automated data processing engine that actively detects, filters and corrects yield points collected off the combine. 

Calibration during harvest

The Yield Monitor is always recording relative differences in grain volume during harvest. Incorrect or incomplete calibrations can be corrected after the fact via post-harvest calibration.

9 map layers

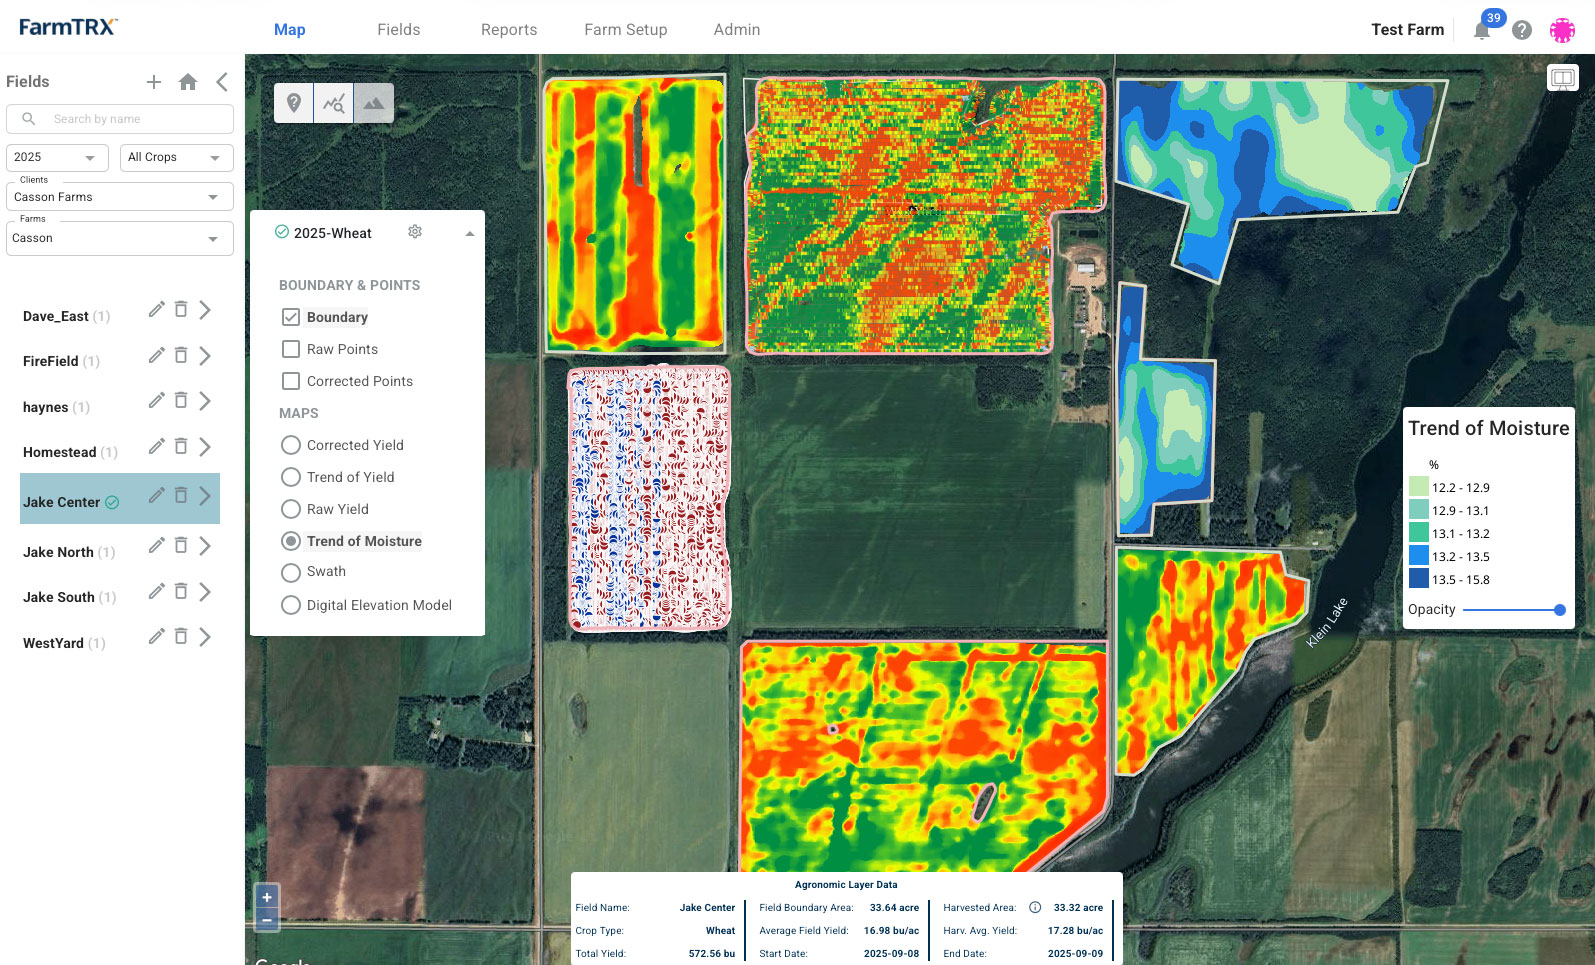
After yield data is processed, farmers can view their yield data in 9 different map layers, including Corrected yield, Trend of yield, Raw yield, Trend of moisture, Swath, Digital elevation model, and more.

Auto-sync

Yield maps will begin to process immediately upon data sync to the Web App – either via 4G cellular networks or WiFi. Maps are finished processing within an hour, often times much quicker.

Basic vs Premium

All Yield Monitors come with one year free Premium membership. The farmer then has the option to renew by signing up for an annual subscription (fee is based on farm size).

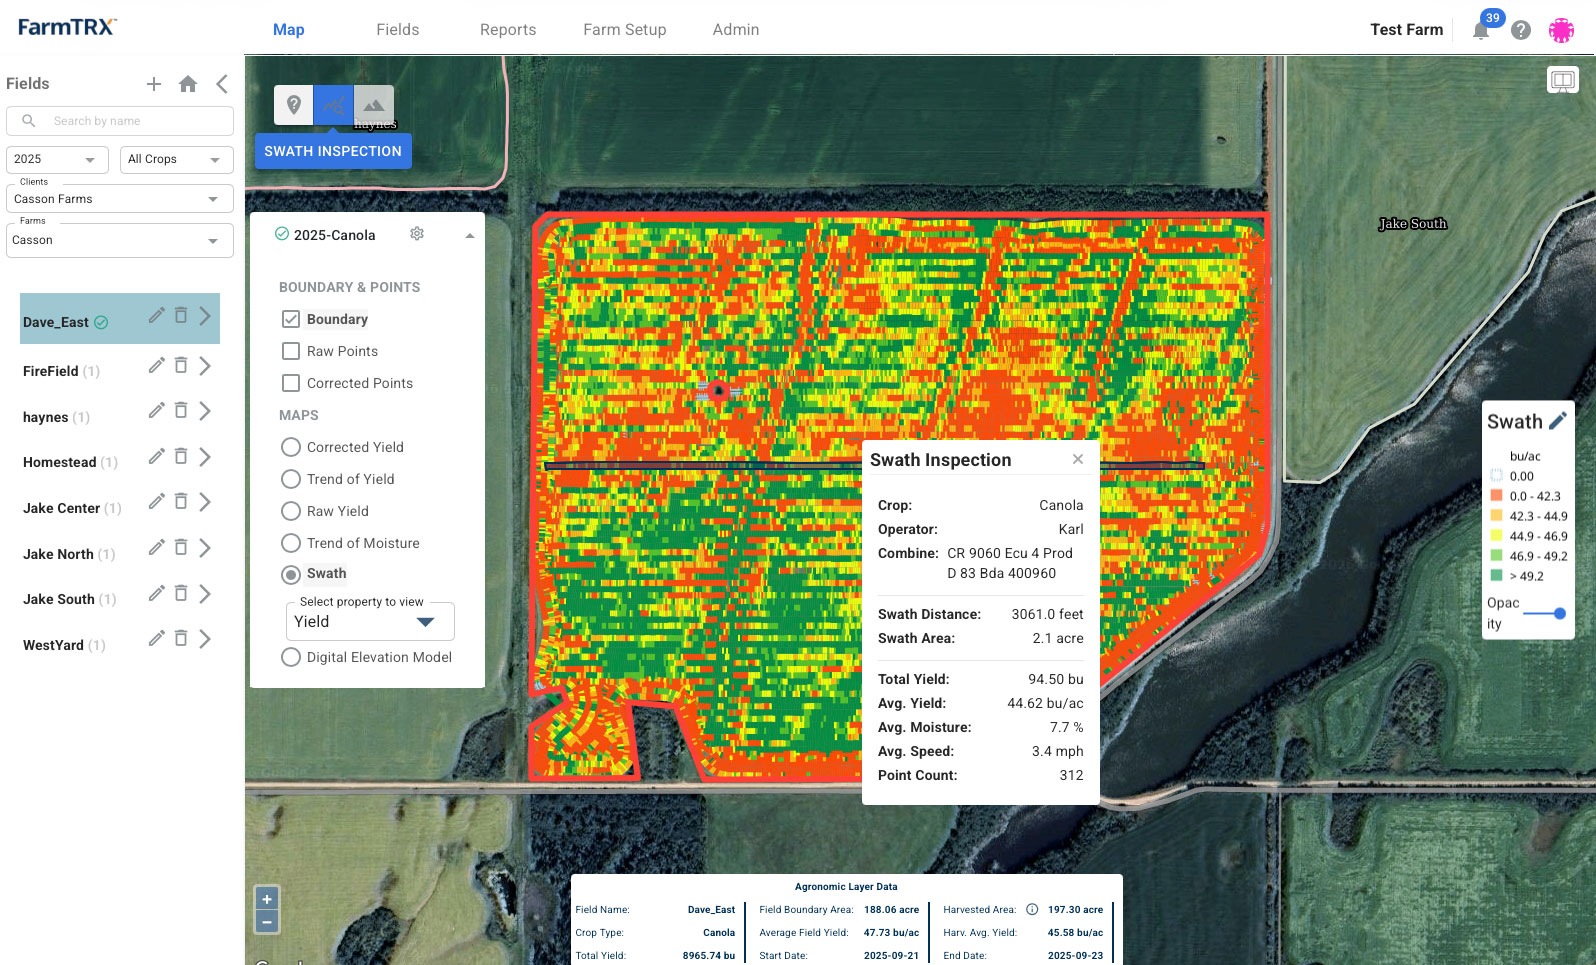
Swath Inspection Tool

Quickly inspect harvested swaths and analyze coverage and yield variability in greater detail.

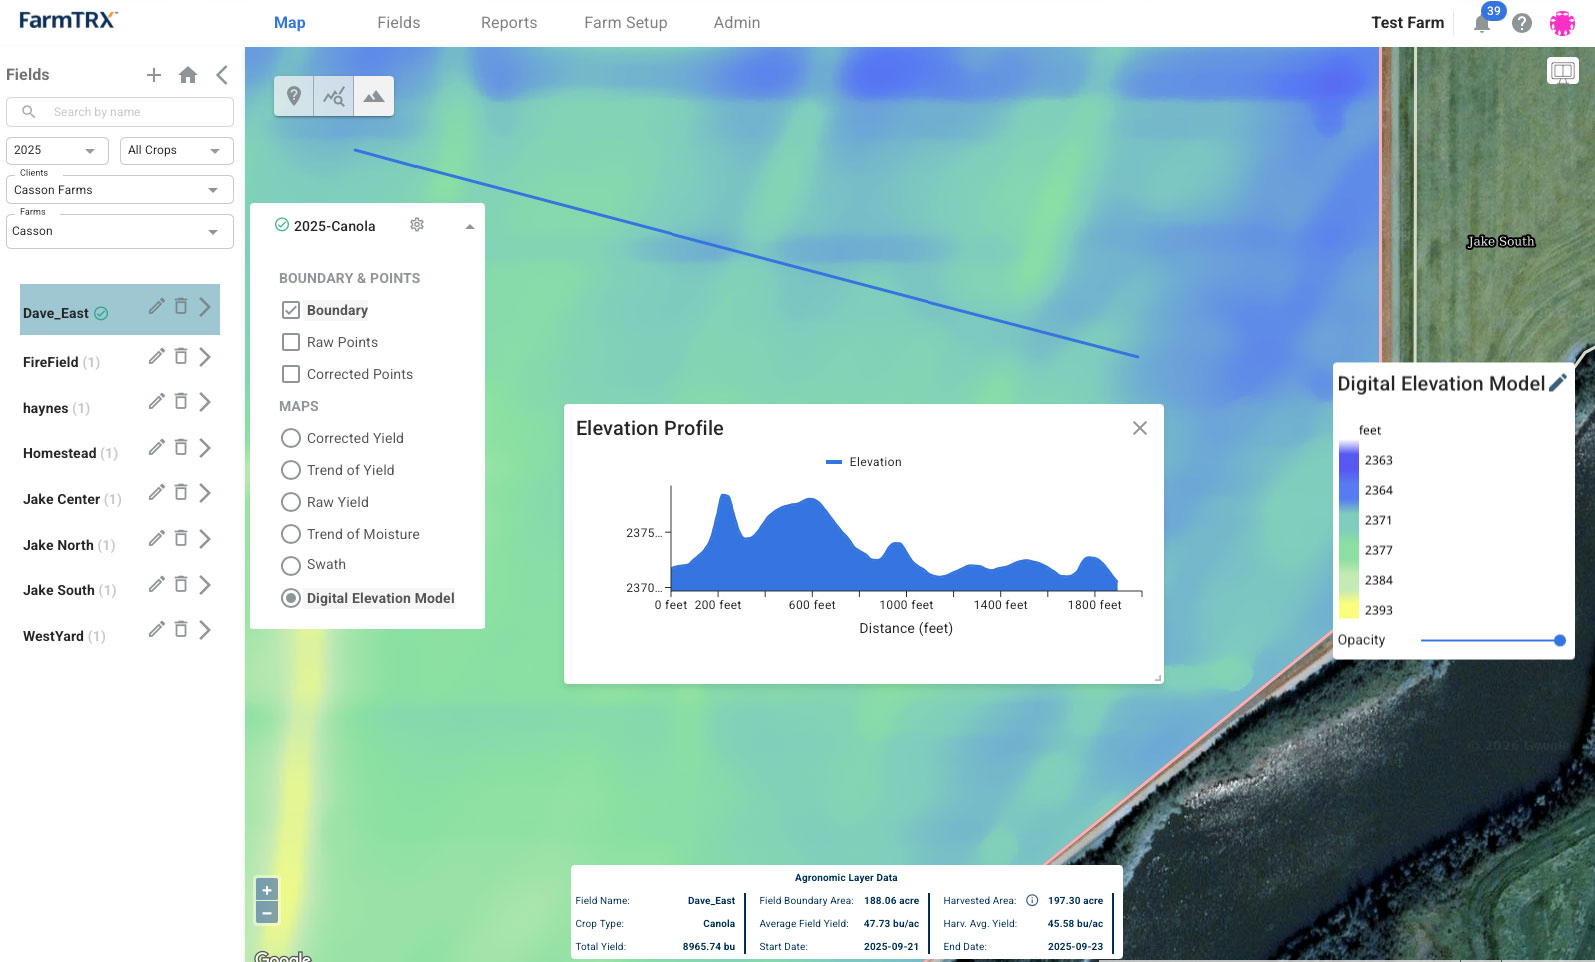
Elevation Profile Viewer

Visualize elevation changes across your fields to better understand how terrain may impact yield and moisture performance.

DEM Custom Legends

Customize elevation map legends for clearer visualization and easier interpretation of field topography data.

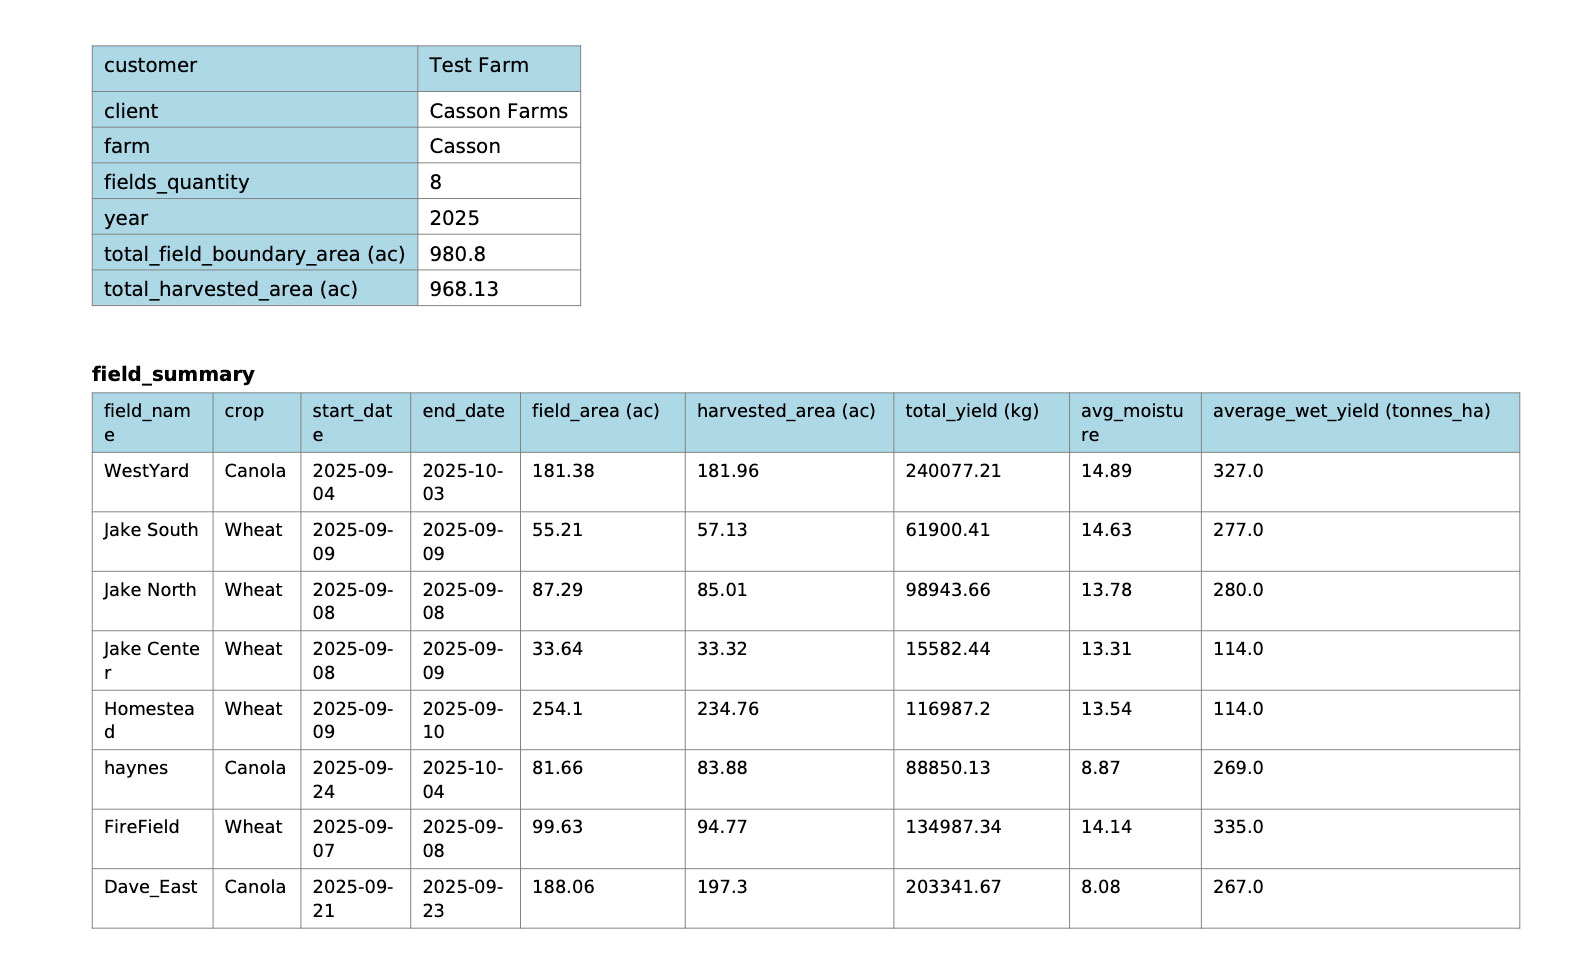
Farm Reports

Generate streamlined reports that summarize field and farm performance data in an easy-to-share format.

Client-Farm-Field Archive Management

Improved archive management tools make it easier to organize and manage field histories across customers, farms, and fields.

Performance Improvements

We’ve significantly improved processing speed and responsiveness for customers managing very large datasets and multi-year field histories. Loading times for the largest data sets have been reduced by up to 80%. 

FarmTRX Web App digital elevation models

Elevation Profile Viewer – Visualize elevation changes across your fields to better understand how terrain may impact yield and moisture performance.

FarmTRX Web App swath inspection tool

Swath Inspection Tool – Quickly inspect harvested swaths and analyze coverage and yield variability in greater detail.

FarmTRX Web App farm reports

Farm Reports – Generate streamlined reports that summarize field and farm performance data in an easy-to-share format.

FarmTRX Web App improved performance

Performance Improvements – Improved processing speed and responsiveness. Loading times for large data sets and multi-year field histories have been reduced by up to 80%. 

Six ways farmers use yield maps

1. Validating trials and products. By overlaying FarmTRX yield maps with application layers or other sources of data, farmers can validate many aspects of a trial and make a decision on whether to use the same products in the future.  

2. Make a variable rate prescription map. Yield maps can be combined with other data  layers such as EC topography and soil tests, helping farmers determine the variability across their fields.  

3. Contracted harvesting. Contract harvesters use yield maps to pass along report cards on the performance of their field to clients. It also helps with billing and validate work completed  

4. Soil sampling. Farmers use yield maps to identify soil sampling locations to help determine what caused high and low yielding areas of the field.  

5. Traceability. Farmers in the Carbon Action Network in Finland use FarmTRX  yield maps to validate changes in soil health and carbon sequestration. 

6. Crop insurance. FarmTRX yield maps can help prove that areas have been damaged by animals or weather events, and help farmers reconcile crop insurance claims much faster and easier.

We collect raw yield data from hundreds of FarmTRX Yield Monitors via a custom API. This data is used to generate clean and corrected yield maps for over 1M acres. It would be qualitatively impossible for us to review the results of our field experiments without yield maps. The same maps also enable differential planting and variable-rate fertilizer applications, as they confirm high and low productivity zones in our fields.

Valerii Datsenko, Kernel

Valerii Datsenko, Head of
Precision Agriculture, Kernel

May 27, 2026 in Blog

FarmTRX Premium Web App – New features & pricing tiers

We have recently made a number of important upgrades to the FarmTRX Premium Web App — including powerful new analysis tools, improved field management features, and major performance enhancements. These…
Read More
April 1, 2026 in Blog

Yield Monitor delivers 98.7% accuracy in real-world test

Precision agriculture has transformed farming from a field-level practice into a data-driven science, and at the heart of every farming operation is the question of yield. It’s what pays the bills…
Read More
March 18, 2026 in Blog

FarmTRX delivers yield data to Kernel’s 1.2M acre mega-farm

Ukrainian agro-giant Kernel, in association with its partners, runs one of the biggest grain farms in the world. The operation spans 6,000 fields and more than 500,000 hectares of land,…
Read More
February 5, 2026 in Blog

Yield maps – taking the guesswork out of precision agriculture

Precision agriculture is a data-driven and fine-grained approach to farming that aims to lower costs and maximize yields by considering local variances across a field. This process depends on one critical foundation: accurate yield maps that provide detailed information about how much each field produced at harvest time, acre by acre.…
Read More