
Precision agriculture is a data-driven and fine-grained approach to farming that aims to lower costs and maximize yields by considering local variances across a field. This process depends on one critical foundation: accurate yield maps that provide detailed information about how much each field produced at harvest time, acre by acre.
Before accurate yield maps were widely available, farmers evaluated their fields based on averages, or intuition, and they often ended up using the same amount of seed, fertilizer, and nutrients across their field. Without detailed yield maps they wasted resources in low-producing areas and missed the opportunity to improve yields in high-performance zones.
Stats show that most small farms and many mid-size farms in North America have an operating margin of 10% or less which puts them into the “significant financial risk” category. Building detailed yield maps, and the precision agriculture operations they enable, is one of the most reliable ways to increase productivity and profitability of your farm.
What is a yield map?
Yield maps are created by combining data from yield sensors, moisture sensors, header height sensors, and GPS. These maps can show precisely how much crop was produced at different locations across a field during harvest.
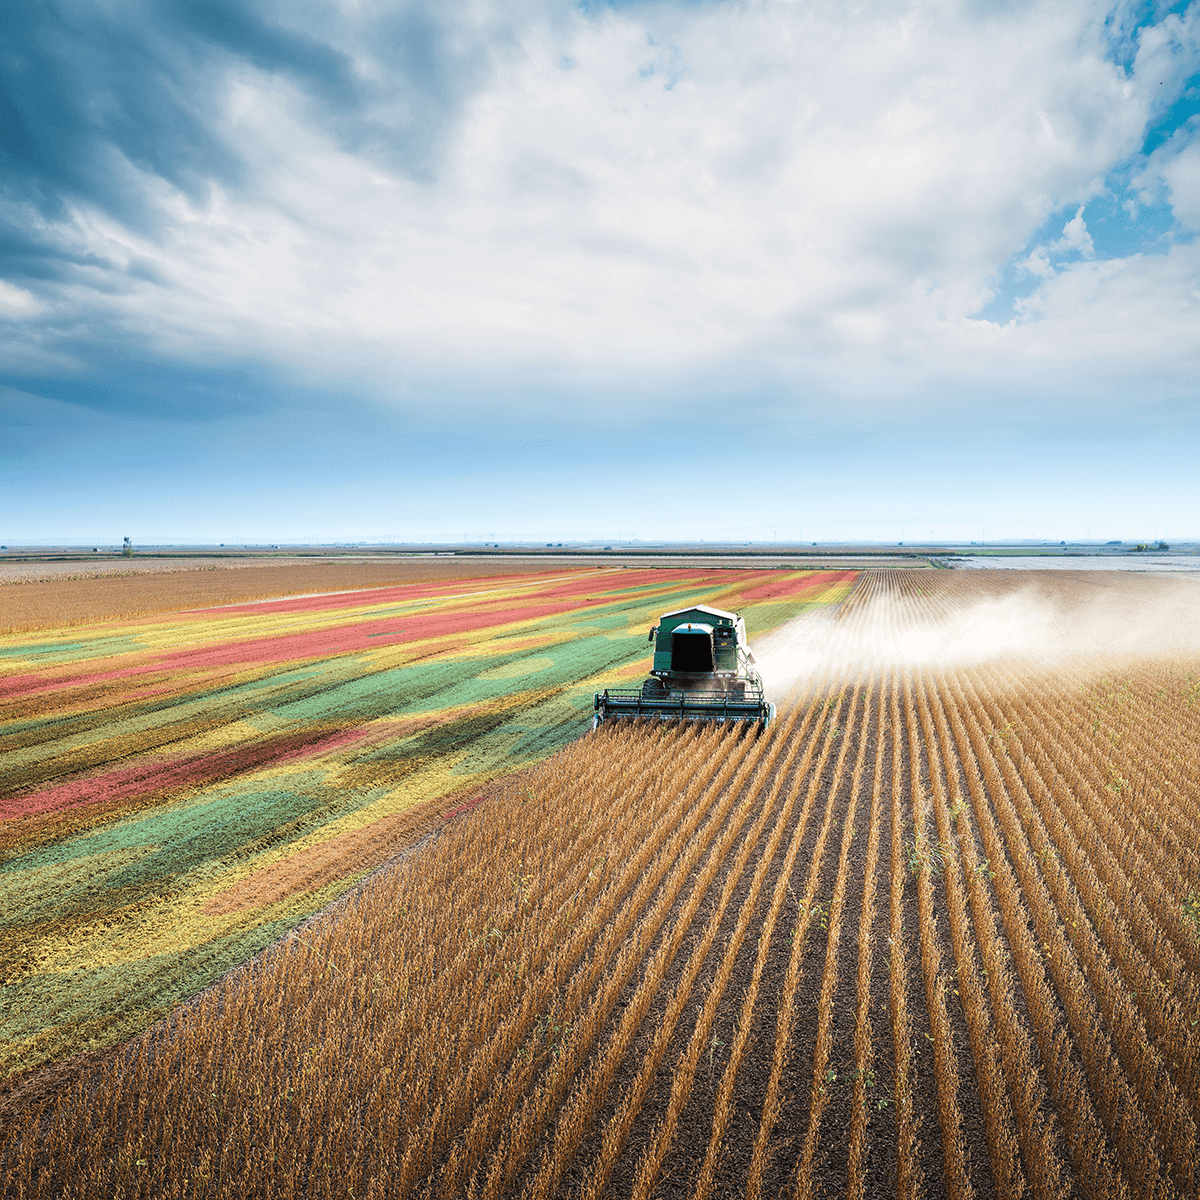
As the combine moves through the field, the system records yield and moisture data in real time, building a precise, spatial view of performance across every acre. The most sophisticated yield monitoring systems can take advantage of error-correction technologies like PPP HAS and RTK, and record positions with an accuracy of down to a few centimeters on the horizontal plane.
Header height sensors help improve the accuracy of yield maps by telling the system to collect yield data only when the header is in the working position. These sensors can also improve the in-cab calculation of harvested area and provide real-time cut height feedback to the operator.
Once all the raw data from each sensor has been collected, sophisticated algorithms are applied to account for areas that could introduce errors if left uncorrected. For instance, around the edges of a field it is common for a combine to do a partial swath where the remaining crops only cover half the width of the combine, resulting in only half the amount of grain being harvested compared to a full row. Without corrections, the yield map might show this area as a low-performance part of the field, although it might be the opposite.
Post-harvest data corrections will use the defined field borders and precise GPS locations to identify all the various turns and edge rows that a combine moves through and make adjustments as needed.
Premium yield mapping solutions can seamlessly consolidate data from multiple combines working the same field, or multiple fields, resulting in detailed, accurate, color-coded map of your fields, divided into High (green), Medium (yellow), and Low (red)-performing zones.
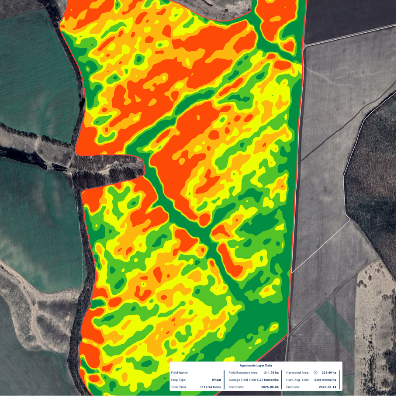
The core value of yield maps comes from their ability to reveal variability in great detail—high-performing zones, underperforming areas, and patterns tied to soil type, topography, seeding rates, fertilizer programs, drainage, weather, management practices, and more.
Agronomists use yield maps to provide quantifiable benefits to farmers season after season. Experienced farmers are well aware of where the good and bad spots are in their fields, but few of them realize how much money they lose by wasting resources in the bad spots, and how much money they leave on the table by not taking full advantage of the good spots. For farms operating on thin margins, this insight can make the difference between making and losing money.
How yield maps improve input decisions
While different farmers use the collected data differently, yield maps often play a central role in improving how inputs are applied across a field. Over time, most precision farmers use yield data to:
- Identify zones that consistently underperform and investigate why
- Adjust variable-rate seeding to better match yield potential
- Fine-tune fertilizer and nutrient applications
- Compare hybrid and variety performance across soil types
- Reduce over-application in areas that don’t respond to added inputs
These adjustments don’t just improve yields; they help control costs. By aligning inputs with actual field performance, farmers can improve return on investment acre by acre.
In addition to optimizing how resources are allocated across the fields, precision agriculture is a tool that can be used to minimize environmental impacts, e.g., reducing the use of fertilizers and nutrients in low-producing areas.
Making yield maps affordable and accessible for more farmers
If this sounds great, the question is why don’t all farmers jump into the precision agriculture pond, feet first? In short, it often comes down to cost, usability, and a well-earned skepticism against AgTech marketing promises.
If you have a relatively new combine, it likely came equipped with a factory-installed yield monitoring system. The problem is, a surprisingly large portion of these monitors remain unused, or certainly under-used.
Many of these growers keep an eye on the yield numbers while they’re in the cab, but they don’t collect the data to build detailed and usable yield maps post-harvest at a desk or with an agronomist. Why? Because hard-to-figure-out interfaces, and time-consuming processes for even basic features like calibration make people give up. Time-pressures during harvest are real, and the patience for dealing with annoying tech is low. Nobody has the time to train each operator to correctly navigate complex menus, tabs, and multi-step procedures.
If, on the other hand, like a large percentage of global farmers, you use a mixed fleet of older machines that are still mechanically sound but lack modern sensors, what can you do if you’d like to try precision agriculture?
Improving interoperability and affordability with ISOBUS
Luckily, there are good options available for both older and newer combines.
Retrofit sensor systems—like FarmTRX—are built with ease-of-use in mind. They make it possible to add accurate yield, moisture, and header height monitoring to any combine model with a clean grain elevator.
Farmers can install the required sensors in a few hours and turn existing machines into data-generating assets at a fraction of what it would cost to replace equipment or invest in expensive, OEM upgrades. Prices vary, of course, but you can expect to pay about a quarter of what it would cost to use branded systems from the big manufacturers. Sometimes less.
The best independent yield monitoring systems are standards-based, i.e. ISOBUS (ISO 11783), offering full interoperability with existing equipment and farm management systems. This allows farmers to mix and match machines and sensors from different brands and use the components they prefer as they build an affordable, intuitive, precision agriculture solution that works for them.
Using yield maps to take the guesswork out of farming
Yield maps are not just about understanding last season—they’re about building a historical record that supports smarter decisions year after year. When combined with cloud-based farm management platforms, yield data becomes a powerful tool for planning, benchmarking, cost reduction, and continuous improvement.
By making yield monitoring affordable, accurate, and compatible with both older equipment and modern farm management systems, FarmTRX helps growers take the guesswork out of farming, and establish the data foundation they need for profitable precision agriculture.
